
Growth Loops vs Funnels: Why Your Acquisition Math Keeps Breaking
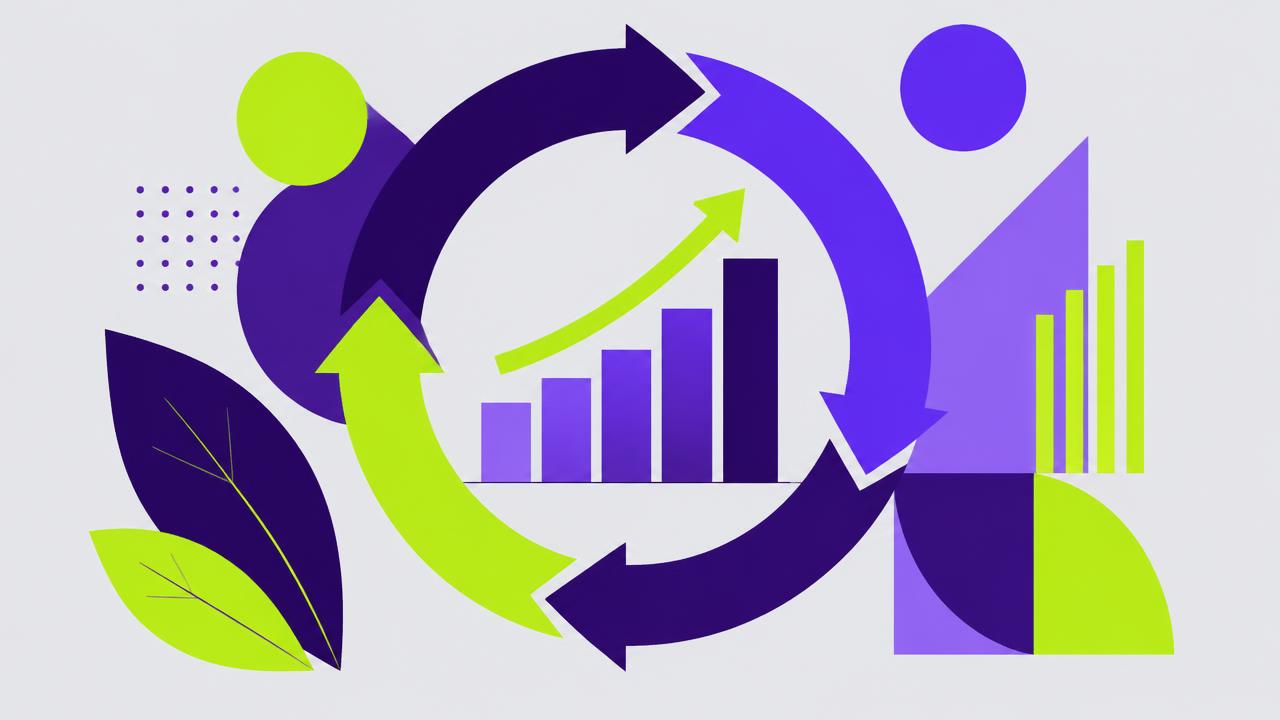
Almost every acquisition model presented in a board deck is a funnel: impressions at the top, a series of conversion rates, revenue at the bottom. It is a useful accounting device and a terrible planning device. A funnel describes what happens to one cohort on one journey. It has no opinion about what that cohort produces afterwards, which is precisely the thing that determines whether growth compounds or plateaus.
A loop is the same journey drawn as a circle. A user arrives, does something valuable, and that action produces a new input to the top of the system — an invitation, a public artifact, a review, a piece of content indexed by Google, or simply margin that can be reinvested in ads. If the output per cycle exceeds the input, the system grows without you buying every user individually.
The three numbers that define a loop
Every loop, regardless of type, is described by three variables. First, output per user: how many new users one existing user generates per cycle. Second, cycle time: how long it takes for that output to arrive. Third, decay: how quickly output falls off as the loop saturates its addressable pool.
Teams obsess over the first number and ignore the second. That is a mistake, because compounding is exponential in cycles, not in coefficient. Consider two referral programmes over a 180-day horizon.
| Loop | Output per user (k) | Cycle time | Cycles in 180 days | Users from 1,000 seeds |
|---|---|---|---|---|
| Fast, weak | 0.40 | 5 days | 36 | ~1,667 total |
| Slow, strong | 0.70 | 40 days | 4.5 | ~1,300 total |
| Fast, strong | 0.70 | 5 days | 36 | ~3,300 total |
Neither of the first two is viral in the runaway sense — both have k below 1, so the series converges. But the fast loop reaches its ceiling inside a quarter while the slow loop is still working through its second cycle when the planning period ends. Halving cycle time is usually cheaper than doubling the coefficient, and almost nobody prioritises it.
Four loop types, and how they actually behave
It helps to name the loop you are trying to build, because the levers differ.
1. Viral loops
A user invites another user as a by-product of getting value. The strong versions are collaborative: file sharing, multiplayer, shared dashboards. The weak versions are bolted-on referral schemes, which usually deliver k between 0.05 and 0.15 in non-transactional categories. Before you build one, check whether the product produces a natural reason to involve a second person. If it does not, an incentive will not manufacture one.
2. Content loops
Usage produces public artifacts that acquire traffic. Review sites, marketplaces, community forums and templates galleries all work this way. Cycle time is dominated by indexing and ranking latency — typically 60 to 120 days before a page reaches its stable position — so content loops feel dead for a quarter and then behave like an annuity.
3. Paid loops
Revenue from cohort N funds acquisition of cohort N+1. This is a real loop, but only if contribution margin arrives inside a cycle time you can finance. A business with 70% gross margin and a 14-day payback compounds spend monthly. A business with an 11-month payback is not running a loop; it is running a financing operation, and its growth rate is set by its balance sheet, not its marketing.
4. Sales and data loops
Each customer improves the product (data network effects) or produces a case study, benchmark or integration that lowers the cost of the next sale. The output is not a user, it is a conversion rate improvement — easy to miss in dashboards, and often the most durable advantage of the four.
The question is not "what is our funnel conversion rate?" but "what does one customer produce, and how fast?"
Diagnosing which one you have
There is a simple test. Freeze paid spend for a defined period — two weeks is usually enough — and measure new user arrivals by source. Whatever remains is loop-driven. Most teams discover that 85 to 95% of their acquisition stops when the card stops. That is a funnel business with a media budget, which is a legitimate model, but it should be planned as one: growth is linear in spend and capped by channel liquidity.
Rule of thumb: if organic and referred arrivals do not grow in proportion to your active user base, you do not have a loop. You have a channel.
Why three weak loops lose to one strong one
A common failure pattern: a team builds a referral programme (k = 0.08), a template gallery (k = 0.05) and an affiliate scheme (k = 0.06). Total output is 0.19 per user, spread across three systems that each need maintenance, analytics and creative refresh. None of them is close to self-sustaining, and the effort is split so thinly that none ever improves.
The alternative is to pick the loop with the highest ceiling given your product mechanics, and put a full team on cycle time and output for two quarters. A single loop taken from 0.15 to 0.45 changes the shape of the business; three loops nudged from 0.05 to 0.07 do not change anything at all.
Instrumenting the loop properly
Standard attribution tooling is built for funnels and will actively mislead you here. You need three additions. Track invitation lineage: store the referring user id on every new account so cohorts can be traced to parents. Track time-to-first-output: the median days between a user activating and producing their first new input. And track saturation: output per user segmented by cohort age and by market, because loops die market by market rather than all at once.
When those three series are on one chart, planning conversations change. Instead of arguing about whether to spend more on ads, the team argues about whether the median 19-day time-to-first-invite can be cut to nine — a question with a concrete product answer.
Where funnels still win
None of this makes funnel analysis obsolete. Funnels are the right tool for diagnosing a specific journey: which step leaks, where the drop is sharpest, what a checkout redesign is worth. Use funnels for optimisation inside a cycle, and loops for planning across cycles. The failure is using one where the other belongs — and the tell is a forecast that assumes conversion rates stay flat while spend triples.
Build the loop diagram first, put the three numbers on it, and only then draw the funnel inside it.
Related articles
Referral Programs That Work, and the Four Reasons Most Do Not
A referral program is not an incentive, it is a moment. Get the moment wrong and no reward size will save it.
How to Run Pricing Experiments Without Breaking Trust
A ten percent price increase absorbed without churn is worth more than most acquisition campaigns. The question is how to find out safely.
Reading Retention Curves Without Fooling Yourself
A flattening curve means you have a product. A curve that reaches zero means you have a series of transactions. Everything else follows from that distinction.