
Geo Holdouts: The Most Practical Causal Test
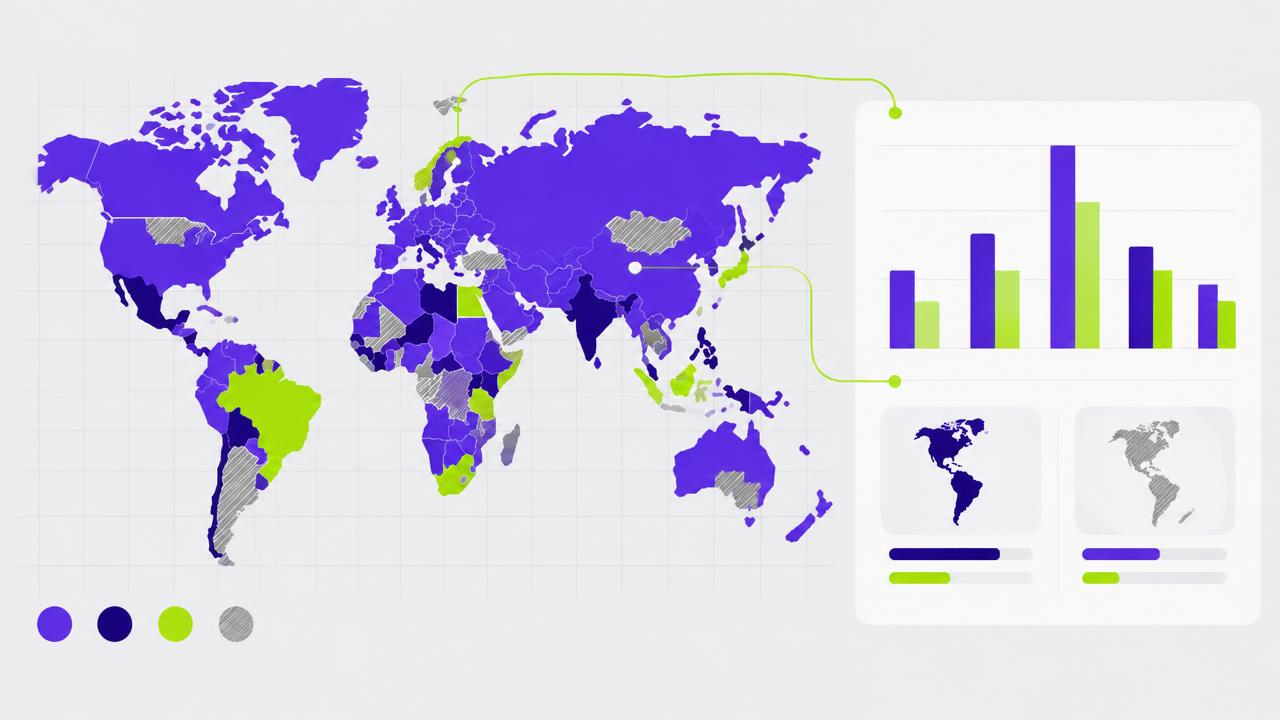
Attribution arguments end when someone runs an experiment. Geo testing is the version of experimentation that most teams can actually execute: split the country into regions, change spend in some, hold others constant, and compare outcomes. No cookies, no consent dependency, no platform cooperation required.
Choosing the regions
The single most important step is matching. Pick control regions whose historical weekly sales track the test regions closely over the previous year — correlation of the trend matters far more than matching population or demographics. Tools exist for synthetic control construction, but a careful manual match on trend beats a careless automated one.
| Design | Best for | Main risk |
|---|---|---|
| Turn off in test regions | Proving a channel works at all | Lost revenue during the test |
| Increase in test regions | Finding saturation points | Needs a larger budget |
| Staggered rollout | Launches you were doing anyway | Confounding with time trends |
Duration and carryover
Run for at least four weeks, and longer if your purchase cycle is long. Advertising keeps working after it stops, so a two-week off-test will understate the effect — the first week largely measures residual demand from prior exposure. Include a post-period to observe recovery, which is itself informative.
The most common geo test error is stopping early because the first week looked flat. The first week is supposed to look flat.
Be honest about power
Geo tests have small effective sample sizes — you have a few dozen regions, not a million users. That means they can detect whether a channel contributes meaningfully, but not whether efficiency improved by six percent. Design the test around a question worth a large answer.
Turn results into a factor
Compare the measured incremental effect with what your attribution reported for the same channel and period. The ratio is a calibration factor you can apply to ongoing reporting until the next test. That is how a one-off experiment keeps paying for itself.
Related articles
The Quarterly Data Quality Audit
Most bad decisions made from data are not made from the wrong analysis. They are made from the right analysis on broken inputs.
Incrementality Testing: The Only Number Your CFO Should Trust
Platform-reported ROAS answers "who touched the sale?" Incrementality answers "would it have happened anyway?" Only the second one supports a budget decision.

Predicting Lifetime Value Without Fooling Yourself
An LTV number that nobody can falsify is not a forecast. It is a permission slip for overspending.