
Incrementality Testing: The Only Number Your CFO Should Trust

The uncomfortable fact underneath most marketing dashboards is that attribution models cannot distinguish between influencing a purchase and observing one. A retargeting ad shown to somebody who had already added the item to their basket will be credited with the sale under almost any model. The platform is not lying; it is answering a different question from the one the finance team is asking.
Incrementality testing answers the finance question: if we had not run this, what would have happened? It requires an experiment, and experiments require discipline, but the alternative is allocating seven-figure budgets on correlations.
Three designs, in order of practicality
Geo holdout
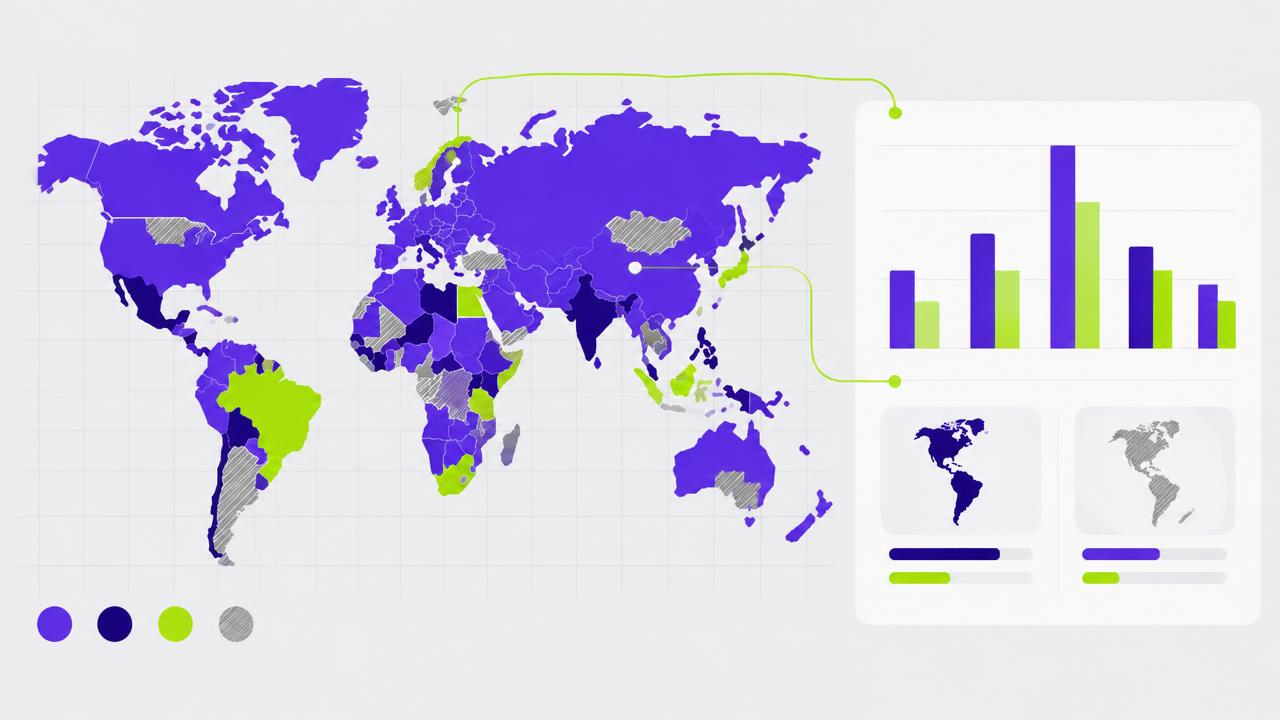
Split comparable regions into treatment and control, run the channel in one set and not the other, and compare total conversions — from all sources, including offline and organic. This is the workhorse design. It measures the channel''s effect on the business rather than on tracked clicks, it is immune to cookie loss, and it works for channels with no click at all, such as TV or out-of-home.
Platform conversion lift
The ad platform withholds ads from a randomised share of the eligible audience and reports the difference. Cheap, fast and well-powered because randomisation happens at user level. The caveat is obvious: the party selling the media is running the test and defining the conversion. Useful for directional decisions, weaker as evidence in a budget argument.
Time-based on/off
Turn the channel off for a period and compare. Easiest to run, weakest inference, because seasonality, promotions and competitor behaviour all vary with time. Acceptable for a very large effect; unreliable for anything under about 15%.
| Design | Strength of evidence | Typical duration | Main limitation |
|---|---|---|---|
| Geo holdout | High | 4-8 weeks | Needs enough comparable regions |
| Platform lift | Medium | 2-4 weeks | Vendor-run, vendor-defined outcome |
| Time on/off | Low | 2-6 weeks | Confounded by everything else |
Powering the test before you run it
The most common reason an incrementality test produces nothing usable is that it was never capable of detecting the effect it was looking for. Work backwards: what lift would change your decision? If you would keep spending at +10% and cut at +2%, you need to distinguish those two, and that determines the sample.
Rough guide: detecting a 10% lift on a baseline of 1,000 weekly conversions typically needs four to six weeks of data across a balanced geo split. Detecting a 3% lift needs an order of magnitude more. If the maths says your test cannot resolve the effect, do not run it — run a bigger intervention instead, such as a full channel pause in half the geos.
Choosing and balancing geos
Do not split by "north and south". Select regions and pair them on pre-period behaviour: conversion volume, conversion rate, average order value and seasonality pattern over at least the preceding twelve weeks. Then randomise within pairs. Ten to twenty balanced pairs is a realistic target for a mid-sized advertiser; fewer than eight and one unusual region can swing the result.
Exclude regions with known distortions — where a retail partner opened a store, where a competitor is running a regional campaign, or where your own sales team is doing something unusual.
Measure total business outcome in the test regions, not tracked conversions. If you measure only what the pixel sees, you have rebuilt attribution with extra steps.
What results usually look like
Patterns repeat across advertisers and are worth knowing in advance, if only to prepare stakeholders.
- Branded search commonly shows low incrementality where organic listings already dominate the page — much of the traffic would arrive anyway. The exception is competitive categories where rivals bid on your brand.
- Retargeting is the classic over-credited channel. Reported ROAS is high because it targets people with demonstrated intent; incremental ROAS is frequently a fraction of it.
- Broad prospecting often looks worse in attribution and better in incrementality tests, because much of its effect lands on channels that get the last click.
- Upper-funnel video shows delayed effects; a four-week test window will understate it. Extend the measurement period past the campaign.
Turning results into a decision rule
A single test produces a calibration factor: incremental conversions divided by platform-reported conversions for that channel. Apply it to ongoing reporting so the day-to-day dashboard is approximately honest between tests. A channel reporting 4.0 ROAS with a 0.55 calibration factor is really delivering about 2.2, and that is the number that belongs in the budget model.
Re-run the test quarterly, or whenever spend changes by more than about 40%. Incrementality is not a property of a channel; it is a property of a channel at a spend level with a given creative against a given competitive set. All three move.
The organisational part
The hardest element is not statistical. It is agreeing before the test what result will change behaviour, and getting that in writing from whoever owns the budget. Tests that begin without that agreement end with a debate about methodology, because the losing side always has one more objection available. Pre-registration — stating the hypothesis, the metric, the duration and the decision rule before launch — is what turns a measurement exercise into a management tool.
Related articles

The Quarterly Data Quality Audit
Most bad decisions made from data are not made from the wrong analysis. They are made from the right analysis on broken inputs.

Predicting Lifetime Value Without Fooling Yourself
An LTV number that nobody can falsify is not a forecast. It is a permission slip for overspending.
Geo Holdouts: The Most Practical Causal Test
When user-level tracking fails, geography is still a reliable way to build a control group.