
UTM Governance and KPI Trees: Boring Work That Makes Data Usable
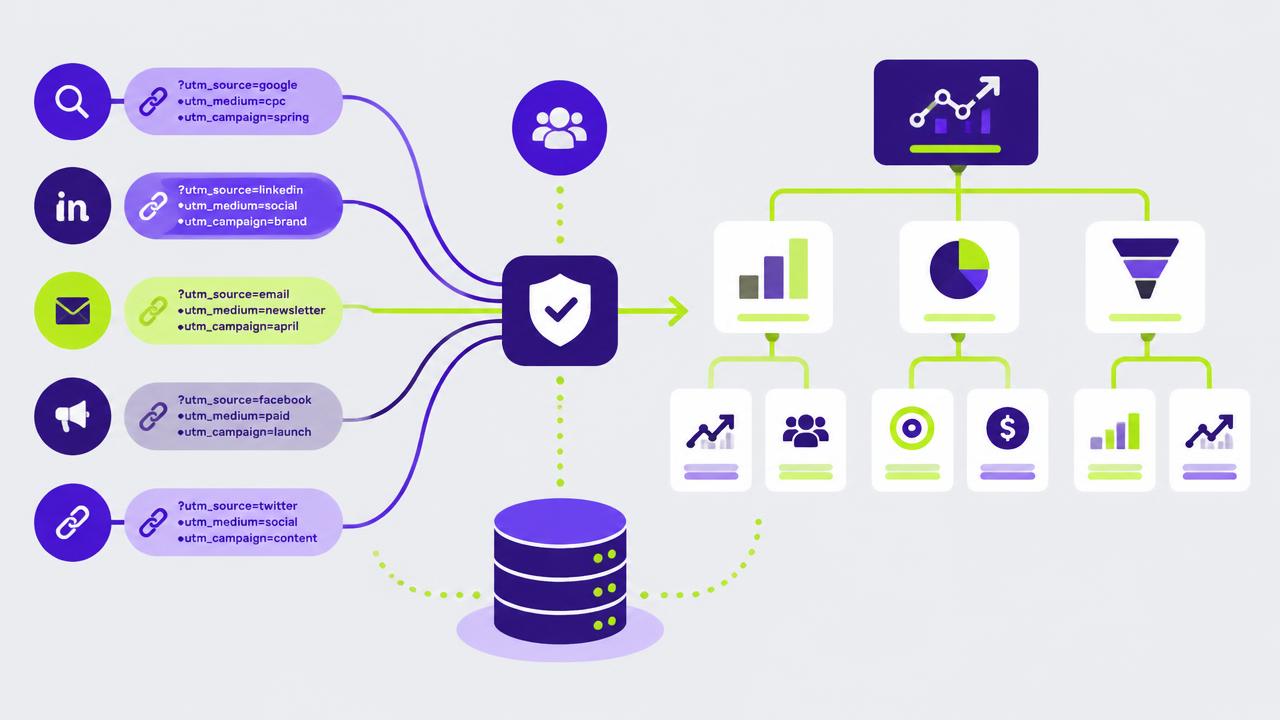
Two facts explain most bad marketing reporting. First, campaign tags are typed by hand by a dozen people who each have their own conventions. Second, nobody has written down what the metrics mean, so two dashboards showing "conversions" count different things. Neither problem is intellectually interesting, and both are more damaging than any modelling choice you will make on top of them.
A UTM standard that survives
The parameters are simple; the discipline is not. The rules that matter:
- Lowercase everything, always. Analytics tools treat Facebook and facebook as different sources, splitting one channel into two rows.
- Controlled vocabulary for source and medium. These two are the grouping backbone. Fix a list — perhaps fifteen sources and eight mediums — and allow no additions without approval.
- Structured campaign names. Use a consistent pattern such as region_objective_offer_yyyymm. Structure means you can parse it later; free text means you cannot.
- Never tag internal links. Tagging a link inside your own site restarts the session attribution and reassigns the conversion to the internal campaign, which is how email gets credited with traffic it never sent.
| Parameter | Purpose | Example values | Controlled? |
|---|---|---|---|
| utm_source | Where the click came from | google, meta, linkedin, newsletter | Yes |
| utm_medium | Type of traffic | cpc, paid_social, email, affiliate | Yes |
| utm_campaign | Initiative | uk_acq_freetrial_202609 | Pattern |
| utm_content | Creative or placement | vid_hook_a, static_price | No |
A policy document does not enforce anything. A link builder that refuses to produce an untagged or non-conforming URL does.
Enforcement in practice
Build or buy a simple tag builder: a form with dropdowns for source and medium, a pattern-validated campaign field, and an output URL. Make it the only sanctioned way to create a tracked link, and give agencies access to it rather than a PDF of rules. Then run a monthly query listing distinct source/medium combinations, sorted by sessions. New values appearing at the bottom are your drift, and drift always returns — a new agency, a new platform, a new hire.
Cleanup tip: do not retroactively rewrite historical tags. Map them instead, with a lookup table in the warehouse that normalises legacy values into the current vocabulary. Rewriting history breaks every saved report that referenced the old value.
The KPI tree
The second half of the problem is that teams optimise numbers with no stated relationship to each other. A KPI tree fixes this by decomposing one top metric into the factors that multiply or add into it, down to the level a team can actually influence.
For a subscription business, one branch looks like: Monthly recurring revenue = active subscribers x average revenue per subscriber. Active subscribers decomposes into new subscribers plus retained minus churned. New subscribers decomposes into sessions x signup rate x trial-to-paid rate. Sessions decomposes by channel, and each channel decomposes into its own inputs — impressions x click-through rate for paid, rankings x click-through for organic.
Two properties make the tree useful. Every node has exactly one owner, and the arithmetic actually holds, so a forecast on any branch can be rolled up. If the maths does not reconcile, the tree is describing a fantasy and should be redrawn until it does.
Define metrics once
Keep a single metric dictionary with four columns: metric name, plain-English definition, the exact query or formula, and the owner. "Conversion" must specify which event, which attribution window, whether refunds are excluded and which time zone stamps the day. Most reporting disputes dissolve once this exists, because they were never disagreements about reality — they were two teams comparing different definitions.
Where possible, implement definitions once in a modelling layer in the warehouse rather than in each BI tool. A metric defined in three dashboards will drift into three metrics within a quarter.
What this buys you
Standardised tags and a defined KPI tree do not improve any campaign directly. What they buy is the ability to answer questions in minutes instead of days, to compare this quarter with last honestly, and to build measurement work — incrementality tests, media mix models, cohort analysis — on data that is not silently broken. Every sophisticated technique downstream assumes this foundation exists. It usually does not.
A week of work, then twenty minutes a month of auditing. It is the highest-return boring project in marketing.
Related articles

The Quarterly Data Quality Audit
Most bad decisions made from data are not made from the wrong analysis. They are made from the right analysis on broken inputs.

Incrementality Testing: The Only Number Your CFO Should Trust
Platform-reported ROAS answers "who touched the sale?" Incrementality answers "would it have happened anyway?" Only the second one supports a budget decision.

Predicting Lifetime Value Without Fooling Yourself
An LTV number that nobody can falsify is not a forecast. It is a permission slip for overspending.